Quick start — generate a datacenter, then ask an agent#
From an empty checkout to a browser-viewable gallery of live diagrams and an agent answering plain-language questions over MCP. About five minutes.
0. Prerequisites#
Go 1.25, Docker (for the CockroachDB dev node), and
just.Graphviz — the one non-obvious dependency. The blast-radius frame shells out to
dot; without it that hero frame fails (the other four screens are pure Go).brew install graphviz # macOS · Linux: apt-get install graphviz command -v dot # sanity checkOptional: an MCP-capable LLM agent (e.g. Claude Code). The last section also shows how to drive MCP by hand with no agent at all.
1. The one-command tour#
git clone git@github.com:lex00/rackattack.git
cd rackattack
just example
just example wipes everything and rebuilds from scratch: it starts CockroachDB,
drops and recreates the database, builds the binary, generates the example-preset
datacenter (deterministically reproducing NARRATIVE.md
— site DFW-02, feed B-3, racks R07–R10), then runs the self-driving
guided tour and opens it. It finishes by printing the example prompts below.
The gallery (example-out/index.html) holds one frame per screen, each painted from
a live query, and every frame is interactive (hover a node for a tooltip,
click for the inspector):

Example output#
The gallery opens with the floor plan — the whole floor at a glance, each rack colored by overall health. On the example preset that’s 7 racks: 4 healthy (green), 2 watch (amber — single-fed, no A/B redundancy), and 1 fault (red — R07, the HGX GPU rack, over its cooling budget). Every cell is hoverable; click one for the inspector.
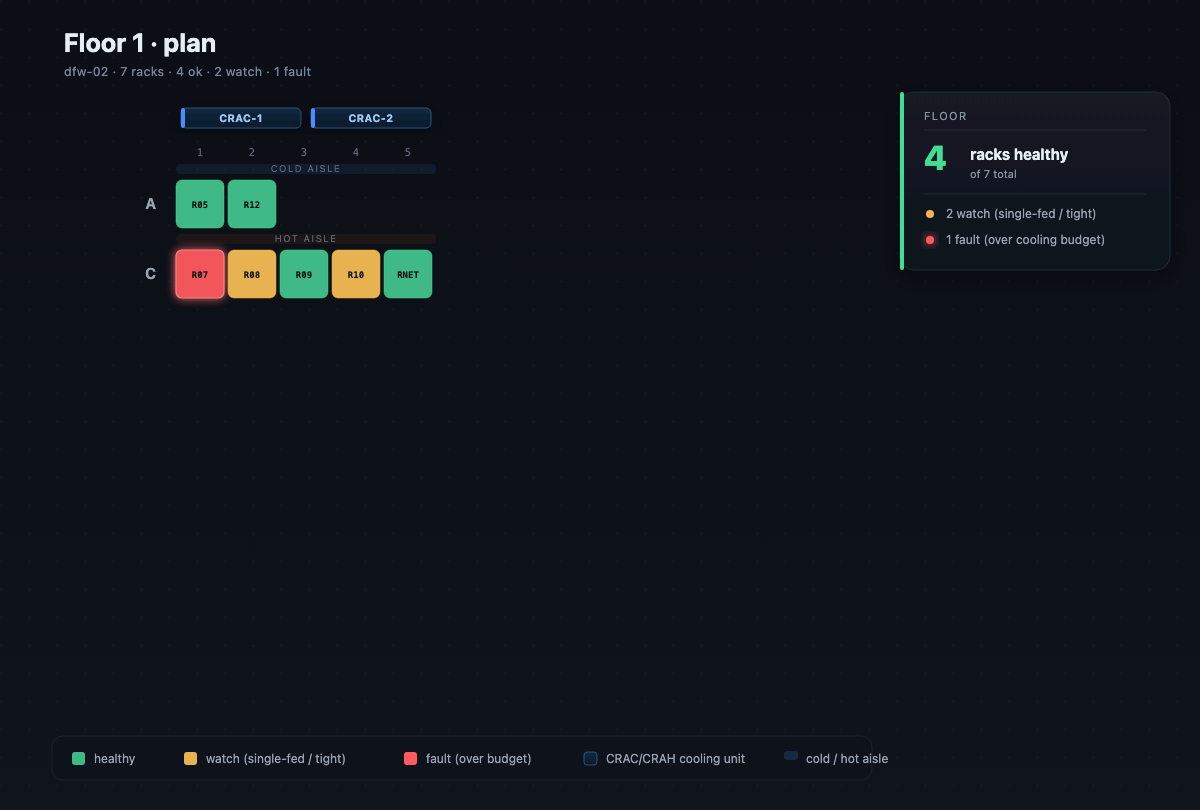
The rest of the gallery walks the incident: power blast-radius, the R07 rack elevation, the floor heatmap, the cable-path trace, and the network fabric.
2. Ask questions over MCP#
The MCP adapter speaks JSON-RPC over stdio and exposes ten tools 1:1 with the service core. Every screen-generating tool returns structured data and a rendered diagram (inline in the reply).
With an agent (Claude Code)#
Register the server once (point it at your built binary):
claude mcp add rackattack -- "$PWD/bin/rackattack" mcpNow just ask. The agent picks the tool, fills the args, and gets back the data plus the diagram. These are the example-preset refs (they reproduce the NARRATIVE outcomes):
| You ask | Tool that fires | You get back |
|---|---|---|
| “Show me the floor plan for dfw-02/1.” | floor_plan{ scope_ref: "floor:dfw-02/1" } | the whole floor by health — 4 ok / 2 watch / 1 fault — floor-plan SVG |
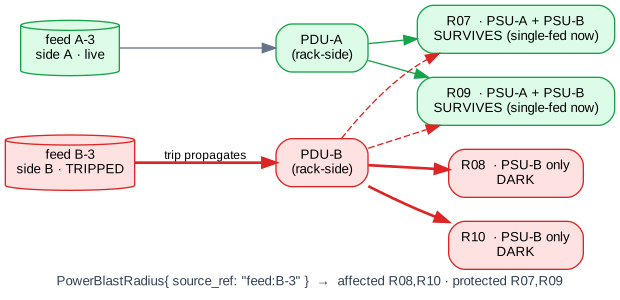
| “What goes dark if feed B-3 trips?” | power_blast_radius{ source_ref: "feed:B-3" } | R08/R10 dark, R07/R09 protected — blast-radius SVG |
| “Show me rack R07 by power draw.” | get_rack{ rack_ref: "rack:R07" } | the HGX GPU rack, over budget — rack-elevation SVG |
| “Where are the thermal hotspots on dfw-02/1?” | thermal_headroom{ scope_ref: "floor:dfw-02/1" } | R07 the lone hotspot — floor-heatmap SVG |
| “Trace the cable from tor-12a port et-0/0/3.” | trace_cable_path{ from_device: "tor-12a", from_port: "et-0/0/3" } | tor-12a → PP-A14 → PP-B09 → spine-2, 50 m — interactive cable-path HTML |
| “Where is the fabric congested in dfw-02?” | fabric_topology{ scope_ref: "site:dfw-02" } | tor-14→spine-3 @97% — network-fabric SVG |
Ref grammar gotcha: most tools take a typed ref (
feed:,rack:,floor:,site:), buttrace_cable_pathtakes two bare args (from_device,from_port) — no prefix.
The blast-radius answer is exactly this picture — affected racks red, survivors green, the rest dimmed:
With no agent (drive MCP by hand)#
Pipe two JSON-RPC frames — initialize, then a tools/call — into the adapter
and pull the SVG out of the reply (it comes back as base64 in render.image):
printf '%s\n' \
  '{"jsonrpc":"2.0","id":1,"method":"initialize","params":{}}' \
  '{"jsonrpc":"2.0","id":2,"method":"tools/call","params":{"name":"power_blast_radius","arguments":{"source_ref":"feed:B-3"}}}' \
  | ./bin/rackattack mcp \
  | jq -r 'select(.id==2) | .result.content[0].text | fromjson | .render.image' \
  | base64 -d > blast-radius.svg

open blast-radius.svg   # macOS  (Linux: xdg-open)
Swap power_blast_radius for any tool — get_rack, thermal_headroom,
trace_cable_path, fabric_topology — to get that screen the same way.
3. The live API (gRPC + REST)#
To hit the service directly instead of through MCP, just run it against a fresh
CockroachDB — serve applies pending migrations on startup, and --seed-example
generates the example fleet when the database is empty:
just up                                  # CockroachDB
rackattack serve --seed-example          # auto-migrate + seed, then serve
serve always auto-migrates; drop --seed-example (or generate your own fleet with
rackattack fleet new …) once data is in place. To wire your own data first, the
explicit steps still work:
rackattack fleet new --preset example    # generate the fleet
rackattack serve                         # gRPC :8080 · REST :8081
# REST (grpc-gateway), against the running service:
curl -s localhost:8081/rackattack.v1.Rackattack/PowerBlastRadius \
-d '{"source_ref":"feed:B-3"}'What just happened#
You stood up CockroachDB, generated a deterministic datacenter, and got back structured data plus a bespoke diagram for every question — no GUI, no pre-built views. That’s the whole product in one loop: the agent is the input, a generated artifact is the output.
Next: Architecture and Data model explain how the query and render layers produce those answers; the API surface lists every tool and its gRPC/REST equivalent.