Rendering — the differentiator#
A GUI is a persistent app you navigate; rackattack cuts it. A visualization is just an artifact the service renders on demand and hands back. The agent is the input, a generated artifact is the output: you ask a question in plain language and rackattack renders exactly the picture that answers it — blast radius with only the affected racks lit red, survivors green, everything else dimmed. The diagram is an answer, not a map.
Graphviz as a layout brain, custom SVG as the painter#
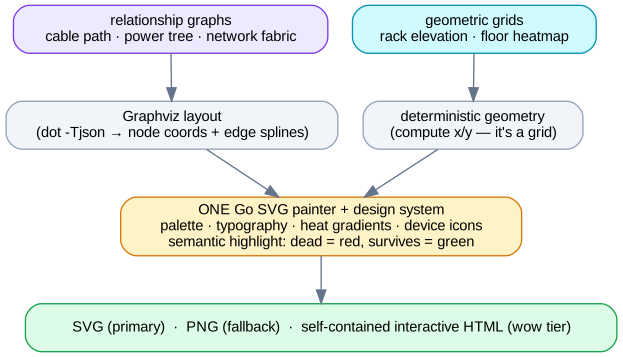
Graphviz has two parts people conflate: a world-class layout engine and a
dated renderer. rackattack keeps the first and throws away the second. Layout
positions come from dot -Tjson; a single custom Go SVG painter (with the shared
design system) does every visual. Geometric screens (rack
elevation, floor heatmap) skip Graphviz entirely — their layout is just a grid we
compute directly.
Delivery: interactivity without a GUI#
- SVG (primary) — vector-crisp, tiny, renders inline in agent chat UIs and any browser.
- PNG (fallback) — for surfaces that need raster.
- Self-contained interactive HTML (wow tier) — one generated
.htmlwith the SVG embedded plus minimal vanilla JS for hover / zoom / pan / click-to-drill. A generated artifact, not a maintained app — no server, no build.
The screens#
The five signature screens, each driven by one tool call (see API and TOOLS.md):
- Blast-radius map ⭐ (hero) — Graphviz-laid power topology, failed feed highlighted, dead racks red, redundant survivors green.
- Cable-path ribbon — left-to-right device cards with port pins, traced path glowing.
- Isometric rack elevation — 2.5D racks, devices colored by heat or power.
- Floor heatmap — geometric grid of racks shaded by thermal headroom.
- Network fabric — legible leaf-spine mesh with utilization.
The approved mockups in
assets/ are the visual
contract: a renderer is “done” when its output matches the mockup for the example
preset.